Andrew Hallam
28.04.2021
Why Retirees Shouldn’t Fear Market Volatility
_
“How are you, Jerry?” you ask, while climbing out of your car. “I’m feeling good today,” he says, as he shuts the door of his Lexus. “I’ve seen the weather forecast, and it shouldn’t be windy.”
You and Jerry started playing tennis together long before you both retired from your high stressed corporate jobs. If a coach compared your skill levels, they would call you equals. Jerry serves as well as you. His groundstrokes are just as solid. He’s nimble on the court. But you beat Jerry every time.
That’s because Jerry gets distracted. When the wind picks up, Jerry freaks out. When people come to watch, he alters his shots. When an errant ball soars his way from a nearby court, Jerry always misses.
You, however, focus on just one thing: getting the ball over the net. You don’t worry about other people, or the wind or how many wild balls lob in from the other court. That’s why you beat Jerry. Unfortunately for him, he frets about the stock market, too. “Have you seen how volatile stocks are these days?” he asks while you’re each warming up. “I read that the Dow Jones Industrials dropped 500 points. Some business reporter says that’s almost as bad as the 507-point drop during the crash of 1987.”
You and Jerry have had this conversation before. “Hey Jerry,” you say, “There are several things to remember. First, volatility is like the wind, or an errant ball from another court. You can’t control it, so you shouldn’t focus on it. If you do, you’ll likely change your strategy and make mistakes.”
Jerry squints and wrinkles his face as he stares from across the net. “But a 500-point drop?”
From your days as a journalist, you know how this works. If a headline bleeds, it leads. That attracts more viewers, and more viewers attract more advertising dollars. That’s why journalists often look for scary headlines. Or they look for people to quote who say scary things. “Jerry, before the 1987 market crash, the Dow traded at about 2,700 points. That 507-point drop was a big deal then. It represented a 22 percent crash in a single day. But today, the Dow is above 33,000 points. So a 500-point fall would only represent a drop of about 1.5 percent.”
“But what if we get another 22 percent plunge today?” he asks. “The markets are so volatile these days. I don’t want to lose my hard-earned money.”
You still remember what Jerry did when the markets dropped during the 2020 COVID-19 fears. Jerry, like many retirees, tweaked his portfolio. He sold plenty of his stock market proceeds, putting much of that money into cash and bonds. But the markets roared back, leaving Jerry on the sidelines. He re-entered the market, several months later, at a much higher price level.
Jerry didn’t want to be lectured, so he tosses his racket aside in a McEnroe-like fit. “Everyone knows stocks are so much more volatile now!” He has been saying this every week for at least 8 years, so you decide to show him something. “
Jerry, sit on this bench. I’ll grab my laptop from the car and show you something interesting.”
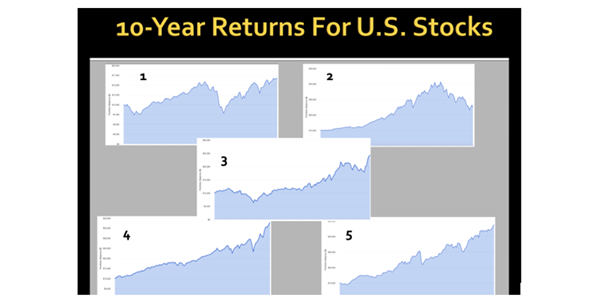
As he waits, you download five U.S. stock market charts and bring the laptop back to the tennis court. You didn’t expect to spend your morning doing this, but you figure it might help Jerry. You show him 5 charts representing different decades for the U.S. stock market:
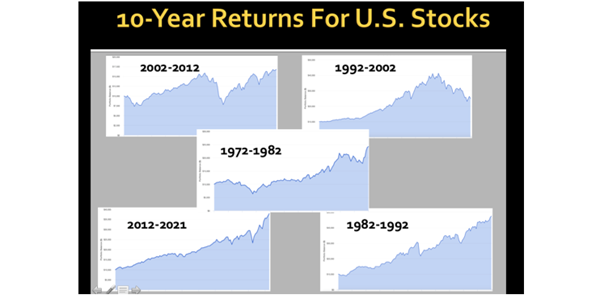
1972-1982
1982-1992
1992-2002
2002-2012
2012-2021 (ending March 31, 2021)
However, you choose not to show him the dates on each chart. Instead, you ask him to select the two most volatile decades, based on visual market movements. Here’s what you show Jerry. Each chart shows how $10,000 would have grown in U.S. stocks, with dividends reinvested over each ten-year period.

Source: portfoliovisualizer.com
After a quick look Jerry says, “Chart number 1 and chart number 2 are the most volatile.”
“Now pick the two least volatile decades,” you ask.
It doesn’t take Jerry long. “Charts 4 and 5 are the least volatile.”
Then you show him the actual years for each chart. For several years, Jerry has been saying, “Stocks have never been this volatile before.” But when we iron days into decades, the period from January 2012- March 31, 2021 (9 years, 3 months) was the least volatile period, compared to the four decades above.

Source: portfoliovisualizer.com
Jerry examines the charts and says, “Ok, but visuals like this don’t show the whole picture.”
“You’re right,” you reply. “That’s why we use something called standard deviation. It measures how much a statistic (or the market, in this case) deviates from its average. The lower the standard deviation, the lower the volatility.”
Standard Deviations For U.S. Stocks
| Decade | Standard Deviation |
|---|---|
| 1972-1982 | 17.06% |
| 1982-1992 | 15.88% |
| 1992-2002 | 15.09% |
| 2002-2012 | 15.91% |
| 2012-2021 (3/31/21) | 13.67% |
Source: portfoliovisualizer.com
Based on standard deviation, the least volatile period was from January 2012 to March 31, 2021. Still unconvinced, Jerry says, “I read a report explaining that day-to-day market swings are higher now then they were in the past.”
At this point, you realize you’ve diverted Jerry’s focus from what really matters. “Jerry, you can’t control day-to-day market movements. They’re much like errant tennis balls from another court. They’re like the wind. They’re like people in the stands. You need to keep your eye on the ball. In other words, stay the course. You’re retired, so stick to withdrawing an inflation-adjusted 4 percent of your portfolio every year. Maintain a diversified portfolio of index funds or ETFs. Don’t speculate…ever. Even when the market crashes (which it will from time-to-time) you shouldn’t run out of money.”
Jerry smiles thinly before sauntering back to the baseline to prepare his first serve. A couple of children begin wrestling and laughing outside the gate. “There are so many more kids fooling around the court these days,” says Jerry. Then he let his first serve fly…straight into the net.
Andrew Hallam is a Digital Nomad. He’s the author of the bestseller, Millionaire Teacher and Millionaire Expat: How To Build Wealth Living Overseas
Swissquote Bank Europe S.A. accepts no responsibility for the content of this report and makes no warranty as to its accuracy of completeness. This report is not intended to be financial advice, or a recommendation for any investment or investment strategy. The information is prepared for general information only, and as such, the specific needs, investment objectives or financial situation of any particular user have not been taken into consideration. Opinions expressed are those of the author, not Swissquote Bank Europe and Swissquote Bank Europe accepts no liability for any loss caused by the use of this information. This report contains information produced by a third party that has been remunerated by Swissquote Bank Europe.
Please note the value of investments can go down as well as up, and you may not get back all the money that you invest. Past performance is no guarantee of future results.
